


14 min read
Building an OKR doc in Coda
Create visibility and keep your team on target with clear goals. Coda allows you to bring your teams objectives and key results into one place that can adapt to your teams needs.

Your team can’t achieve ambiguous goals.
Nothing good happens in a silo. When you’re able to look at the big picture, you can spot trouble and adjust quickly. From startups to large teams alike, teams can’t afford to lose time working on objectives that just aren’t moving the needle. Spotting a lack of progress and iterating quickly can be the difference between hitting and missing targets. Successful teams use their OKR (Objective and Key Results) process as a way to illustrate the team's strategy and drive alignment across their organization. Planning cycles are an opportunity to drive clarity about a team’s mission and the “why” behind what you are focusing on. Great teams tie their goals to their strategy and set clear, unambiguous goals.Create a flexible, effective goal-tracking system with Coda.
Coda centralizes the power of docs, tables, and apps so you can write your strategic direction, update your team, and keep everyone aligned—in one place! Gone are the days where your team writes a strategy document, adds their objectives and key results in a spreadsheet, and tracks progress in another tool. Bring all those elements of the OKR process into a single source of truth with Coda.- Build a single source of truth for your OKRs: Give your team a single place to plan and track.
- Create more effective measuring systems: With Coda, you can curate progress visualizations for stakeholders, connect OKR tables to other docs, and send alerts automatically when things are slipping.
- Empower your team to focus on what matters: Create views that filter all of your team's goals and objectives down to a focused view for each team or even individuals. Each team can even view data in the format they need whether that’s as a table, a timeline, a board, or more.

What you’ll get in this guide
- A single source of truth for your team’s goals.
- Curated progress visualizations.
- Customized tracking systems for individuals and teams.

Features you'll use in this guide
- Tables
- Lookups
- Progress bars
- Views
Setting up your team's OKR doc in Coda
Now let’s get down to building your team's new OKR tracker. We are going to break up our building process into a few key themes. First, we are going to build a way to centralize all your team's objectives and key results to Coda and then we’ll create ways for your team to view these OKRs and track progress.1. Add a welcome page.
A welcome page is a great way to orient your team to your OKR doc and create navigation so they know what to do.- Add a Page by clicking + New Page at the bottom of the Page list on the left-hand side of your doc.
- Name your page by clicking “Untitled” and typing the page name of your choice.
- Add a page icon by clicking Add Icon and then pick the emoji of your choice.
- Add a callout by using the slash command, type /callout and then click on the callout option from the list.
2. Build your table of objectives.
There are going to be multiple key results for each objective in your OKR doc, so the best way to build that is to create separate tables for objectives and key results. We’ll start with the objectives table.- Create a new table using the slash command and type "/table" in your doc and then select blank table.
- Add columns and change column types for your objectives table. We are going to keep it pretty simple and add a column for the name of the objective, and a column with a progress bar. To add a new column, click the gray plus sign in the upper right hand corner of your table.
- When you make a new table it will have a few columns by default but you can delete the ones you don’t need. By default, the progress on your objectives can be manually edited, but we’ll also show how to automatically calculate these based off of your key result progress.
- Add some color to your progress bar by clicking the top of the progress column, then Progress options, and then simply select the color scheme that suits you.
- Change the view by clicking Options on the upper right-hand corner of your table and then change to the card view.
3. Build a key results table, and connect it to your objectives.
With Coda, you can tie different tables of data together. We are going to create a table for your key results and then associate that back to the objectives table that we made in step two.- Create a table and add columns following the same steps above to create your key results table. We are going to need a few more columns for your key results table and a few of these will be different column types. So try adding a date column for your target date, an owner column that can be a text or people column, a status column that works great as a select list column, and a progress bar column works great for updating progress.
- Connect your objectives table to your key results table by adding a column and call it something like “related objective” and set that column type to be a Relation.
4. Add a view for different teams.
Now that we have the core of your OKR process functioning, we can begin to customize the doc to your teams' specific needs. To do this we can create views of your key results table, and filter them to just a subset of the rows in the table.- Add a new page to create a place for your new view.
- Add a view of your key results table by using the slash command to add a table by typing /table, but rather than selecting “blank table” choose your “Key Results” Table.
- Filter your view by hovering over your table in the upper right-hand corner of your table you can click on Filter to open your filter options. In this build, we are going to filter by the related objective. After selecting that you want to filter by the related objective column simply select the related objectives that you want to include in the table and you’re all set!
- This view of your key results is connected to your main table, so if you update the progress in one place it will stay updated everywhere.
5. Combine your strategy documentation with your OKRs.
You have a few options for adding content to Coda. You can add content natively to Coda by dragging in images, writing directly on the canvas, or embedding other sources. To build content directly in Coda:
- Type directly in your doc.
- Add section headers and format the text by starting with the slash command “/” and then selecting one of the options or typing what you want to add. Try something like “/H1” for a large header text. You can also highlight the text that you’ve just written and then you can reformat it.

Bonus: Automate objective progress tracking with a formula.
Now that your key results table is tied to the objectives table, we can add a formula so that when the progress is updated in the key results table the progress for the associated key result will also be updated.- Add a formula that will summarize progress by clicking the top of your progress column will reveal the option to add a formula. After clicking that you should see the formula builder as shown in the picture above. The formula that you are going to write can be seen in this screenshot:
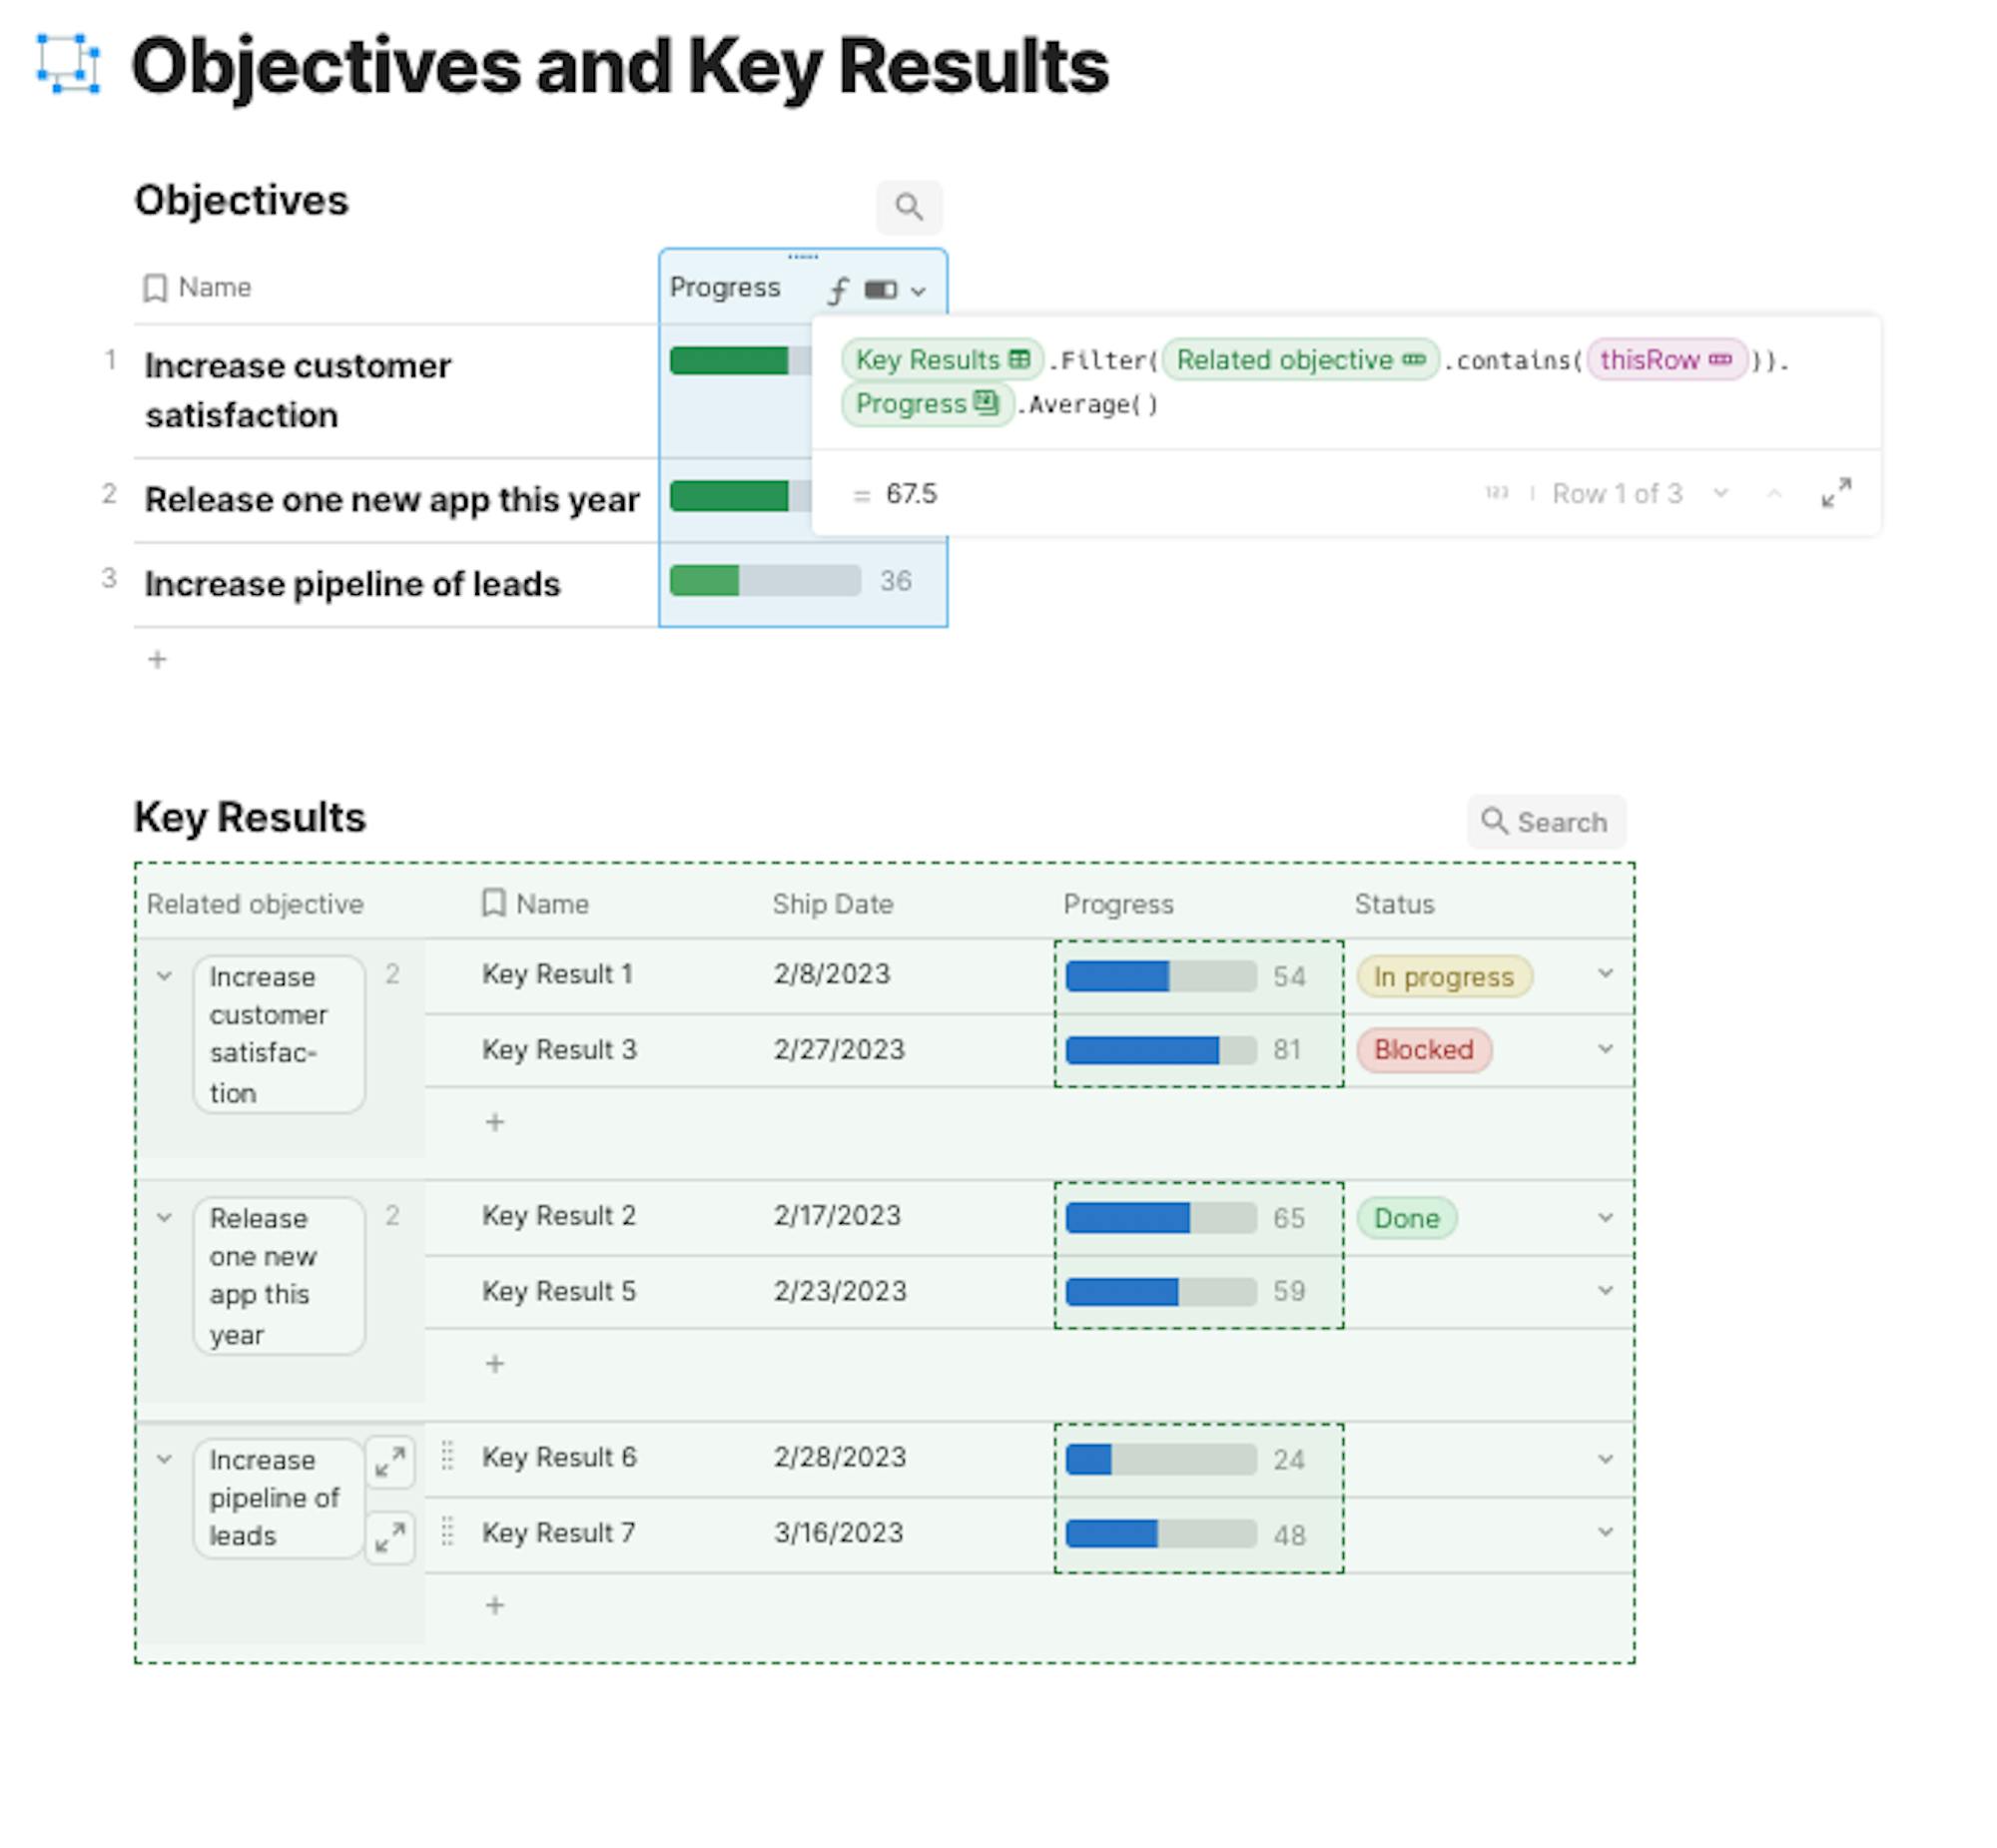
- The first part of this formula (bolded)- [Key Results].Filter([Related objective].contains(thisRow)).Progress.Average()- will start by finding all of the rows in your key results table that match the current row in your objectives table. For example, for the “Increase Customer Satisfaction” objective it will find all of key results where it is selected in the “Related objectives” column.
- The second part of this formula (bolded) - [Key Results].Filter([Related objective].contains(thisRow)).Progress.Average() - is then saying for each of these key results, retrieve the progress and then average them.
- The result is that we have a score for the objectives that is an average of the progress on all of the related key results.
What's next?
Now that you have begun building your OKR tracker, it is a great time to invite your teammates to Coda. Try clicking on Share in the upper right-hand corner of your Coda doc and added them via email or share a link with them. Together you can add to the OKR doc that you've started to make it perfect for your team. Try adding more columns to your base objectives and/or key results tables to the data that your team needs.Was this helpful?
YesNo